With UCF’s season over and Josh Heupel’s first year as a head coach in the books, we finally have a full year of data to examine UCF’s season as well as Heupel’s.
A huge thing with Heupel is play calling, he’s the offensive coordinator and play caller for this team so that’s the number one area I wanted to look at.
So much of play calling has to do with being un-predicatable, you can do this is numerous ways. Run the ball is passing down and distances and vice versa as well as throwing the ball out of running personnel “12” or running out of typical throwing personnel “20” and “10”.
I took a look at down distance play calling and looked at the run-pass advantage based off of UCF’s results from this season alone. There are 4 primary areas where Heupel heavily favored either the run or pass when the opposite play design was significantly more successful.
I also looked at UCF’s success on down and distances based off the offensive target (ball carrier/intended receiver) to look at who Heupel liked to use in certain situations vs. who he actually should’ve used.
Before I get into all that, with Dredrick Snelson declaring for the draft, deservingly so, I want to show you why you should get used to Marlon Williams if you’re a UCF fan.
Marlon Williams:
I’m not quite sure what else Marlon had to do to get on the field this season. Not saying he should’ve played over Snelson, Gabe, or Tre, but there is definitely a way he could’ve gotten on the field a lot more than he did.
Since he stepped on the field at UCF, he’s done nothing, but produce, however he never really seemed to get rewarded for it with more playing time.
Not only does he produce with the ball in his hands, he’s a tremendous blocker as well, a primary reason I wanted UCF to use him as a hybrid tight end this season and run a lot of “10” personnel.
Let’s look at his 2017 numbers:

21 targets as a freshman is very respectable, if you ask me. On those 21 targets, he caught 15 of them, and turned all 15 into successful plays. That’s a 71.43% success rate, almost unheard of. He did have 3 drops.
If a freshman puts up those numbers, they have to get more work as a sophomore right?

Nope.
Williams got almost the identical amount of targets as a sophomore as he did a freshman. The thing is, he still produced at an insanely high rate. His success rate did drop to 63.64%, but asking someone to match a 71.43% rate is unfair.
So in his two years, he has 31 catches on 43 targets with 29 of them being successful (67.44%). On top of that, he can block.

Oh, I forgot to add that he can also run the ball. 4 carries in two years for 16.5 yards per carry. Not too bad. And he can even throw !! I’d say getting the ball in this guys hands is probably a good thing.
There’s no doubt Snelson is going to be a huge loss and you’ll see some of his impact in some of the individual down and distance numbers I post in a little, but Marlon is a guy that should have been on the field more this season and UCF fans, players, and coaches should be more than excited that he’s going to get his opportunity in 2019.
Run vs. Pass Advantage:
This is something that is extremely interesting and is for sure a fun study. I got the idea from Warren Sharp who does a ton of NFL analytics. http://www.sharpfootballanalysis.com/blog/2013/why-coaches-are-dumb
The NFL game the college game are different to study and is a major reason I don’t want to compare UCF’s numbers to his findings, rather just look at UCF’s numbers alone.
1st and 10:
A down and distance coaches love running on, despite usually being more successful throwing the ball.

Heupel ran the ball 54.41% of the time on this down and distance. However, UCF actually had a 2.34% higher success rate when running vs. throwing. They did however, averaged 3.06 more yards per play when throwing. Overall, it worked out pretty well.
2nd Down:
Now is really when it gets interesting.

2nd and 10+ is statistically speaking the dumbest down and distance to run the football. Yet, coaches love to do it.
Heupel is at about a 46.60%/53.40% split. But, UCF isn’t that much better throwing than running, but their is still a 1.70% and 1.73 yards per play advantage. Running the ball at 8.5 ypc almost seems unsustainable over a course of multiple seasons.
2nd and 5-9 is a down and distance that can be looked at either way really in my opinion. Heupel went 60% run here. Now, UCF had a 8.14% success rate passing advantage and averaged 7.07 yards per play more on passes than runs. Definitely a major difference and an area where Heupel should throw more than run.
2nd and 3-5 always comes after a successful play on first down. It’s also a big play in terms of setting up a possible 3rd and 1-2 or being stuck in a 3rd and 3-5 again. Again, Heupel goes run heavy, this time up to 73% of the time. And again their is an advantage to throwing the ball, though a lot smaller at only 1.31%, but also 4.72 yards per play.
2nd and 1-2 is a situation coaches like to take downfield shots, but for the most part is a run situation and should be.
3rd Down:
It is essentially the flip of 2nd down.

3rd and 10+ just an obvious passing situation, nothing to really point out.
3rd and 5-9. We saw on 2nd and 5-9 that Heupel liked to run when he should throw, well it’s the exact opposite on 3rd down and his splits are flipped. UCF averaged 9 ypc compared to 9.8 ypa, so not much of a difference there. However UCF had a -14.05% success rate advantage when throwing as opposed to running, despite throwing the ball 71.15% of the time.
3rd and 3-5. The same exact notion as above, except the disadvantage of throwing the ball is even higher. Throwing the ball here put UCF at a -25% advantage of getting a first down. And despite this, UCF still went pass 67.50% of the time compared to 32.50% of the time.
Look, I’m not saying that it should be 100% run or vice versa in certain spots. You can not agree with analytics in football or sports for that matter and I won’t try and change that, but look at it like this; If you were investing your money in two stocks and one gave you 58.14% chance of making money and on average will go up $12.10 per share that you buy, while the other stock gives you a 50% chance to make money, at a $5.03 increase per share, wouldn’t you invest 60% of your money into the first example and 40% into the second, instead of vice versa? (2nd and 5-9) Why is it different when it comes to football?
4th Down:

Pretty expectant stuff here so I won’t dive into it with anymore crazy analogy’s.
The numbers are pretty self explanatory here, it’s without a doubt something that can be changed, but it’s about realizing it first.
Player based:
So, something fun to look at is what players are getting the carries/targets based on down and distance and who has been the most successful.
Again, I’m not saying in a certain spot this guy should get the ball every single 1st and 10 and another should never get it, but when you need a big play/a positive drive, shouldn’t you want to go with what has worked the most? If not, that’s completely fine, but there is literally nothing that can back up that opinion.
1st and 10:
Easily the most important down and distance and by far the one with the biggest sample size to actually look at the data.
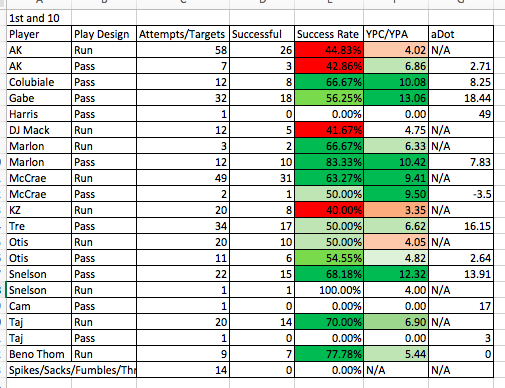
An AK run was by far the most common play here, despite being one of the worst, which I’m sure a lot could’ve guessed. A Greg McCrae run follows that up with a 63.27% success rate while averaging 9.41 ypc. I’d say that’s not a bad play call.
Not going to dive into everyone because the chart pretty much speaks for itself.
Three guys I want to point out. Marlon/Snelson and Taj. I was high on Taj all year and feel like he really got left out of the miss all season and unfairly. He averaged 6.90 ypc on 1st and 10 plays and was successful on 70% of his attempts. Damn it, if you want to get your drive off in a positive note, give the ball to Taj some more.
Snelson I think stands out on just about every one of these that I’ll post. A 68.18% success rate with 12.32 ypa on 1st and 10 is unreal production.
And then there’s Marlon, I talked about him before and I’ll continue to. He was successful on 10 of 12 1st and 10 targets as well as 2 of 3 rushes. That’s 12/15 good for 80%. There is zero reason he shouldn’t have been used more.
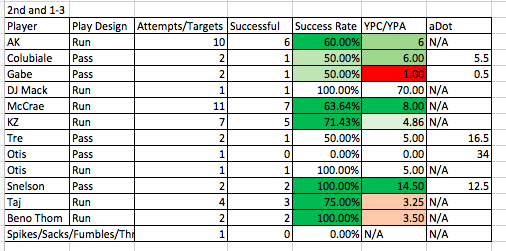
RB runs worked pretty well here.
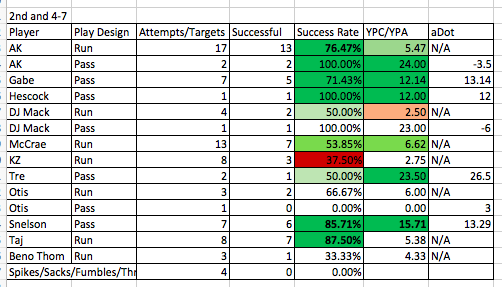
Would love to point out AK and Taj’s success here. 13/17 for AK on a season where you could say he struggled a bit, this is a remarkable number and really stands out and he also was 2 for 2 on receptions, with a -3.5 aDot which would infer both were screens. Again Taj just being Taj.
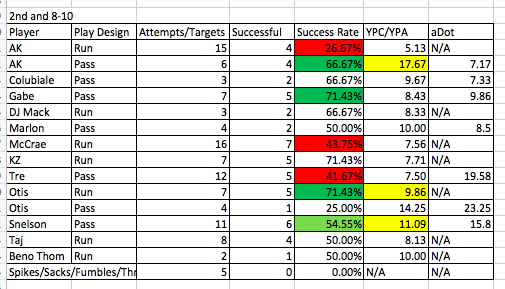
Good old 2nd and long. UCF’s two most common plays, a run to AK and a run to McCrae. Solid for an 11/31 success rate.
Throws to Gabe and Snelson worked out pretty well though.
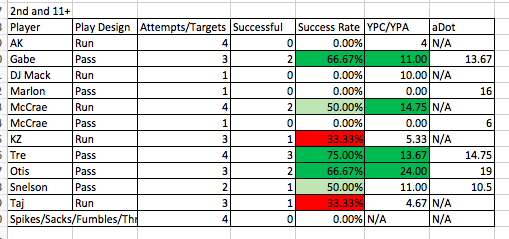
Not enough of a sample size here so I’ll skip it.
3rd Down:
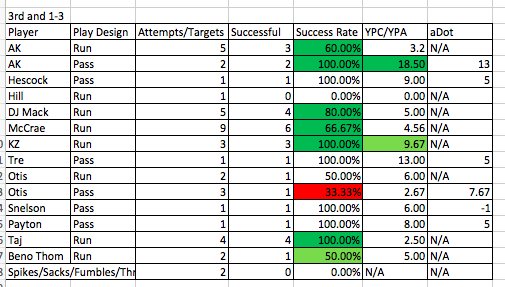
2nd and short RB runs worked, so why not 3rd and short? Taj + AK + Greg = 13/18.
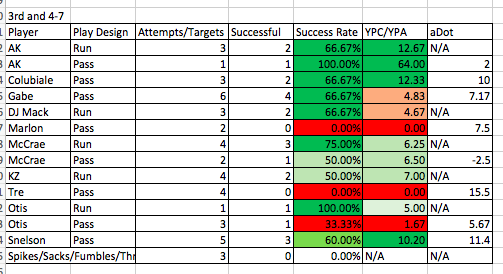
Remember the run of passing situations notion from above? Look here, AK + Mack + KZ + Greg + Otis = 8/12 = 66.67%. Not too bad !!
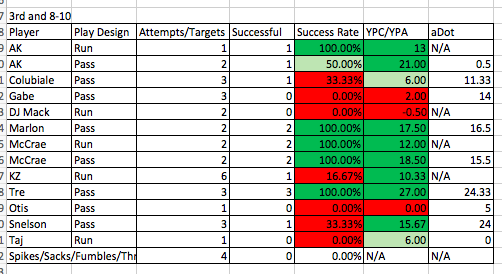
3rd and long, but not too long. Lot of red, lot of red on QB runs and passes. However, this is an area Tre performed very well. And how about 3 of 4 passes to running backs… out of the backfield for the matter… working. What a crazy world when throwing the ball to RB’s out of the back field works (sarcastic).
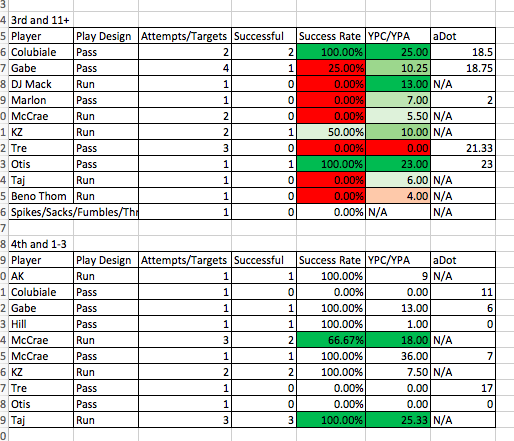
The attempts here are spread out way too much to even really say anything of significance.
Again, I’m not saying every first down you throw the ball to Marlon or Snelson, but hell, when you need a big play and some momentum, it’s not a bad idea. Or don’t run AK on every 2nd 4-7 because he’s successful over 75% of the time, but when the spot comes up on a big drive, it’s probably your best bet. And look, if it doesn’t work, that doesn’t mean it was the wrong call. If you could call plays that work 100% of the time you’d be the first billionaire coach ever.
This will probably be the last thing I study/write about for a while, but I think this is something that’s extremely important. And I can’t wait to watch Marlon get to show how good he is next season.
