UCF finished their 2018 campaign 12-1, following their 13-0 mark in 2017. It was Josh Heupel’s first season as a head coach and he lead one of the most explosive offenses in the country.
I broke down the entire offense using advanced stats in analytics. I looked at individual player performances and went in depth on Heupel’s situational play calling and personnel usage.
While UCF’s offense was extremely productive, it could have been even better and more importantly a lot more consistent. This has nothing to do with the offensive scheme and design from a true football perspective. It all has to do with understanding situations and what gives the offense the best chance to be successful.
I used analytics to explain all of it and really show how valuable the use of analytics could be to a team.
Milton and Mack:
McKenzie Milton and Darriel Mack were the two guys under center this season for UCF. Milton followed up his 8th place Heisman finish in ’17 with a 6th place finish this season, rightfully so.
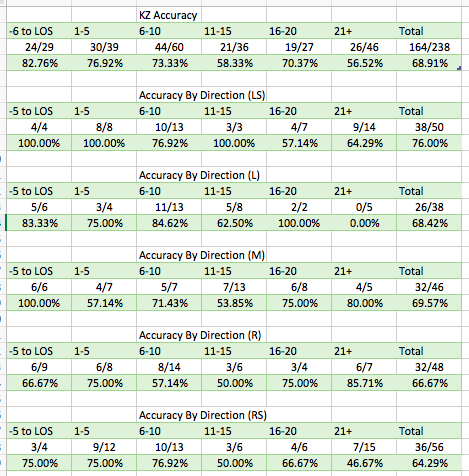
His accuracy was very good once again.
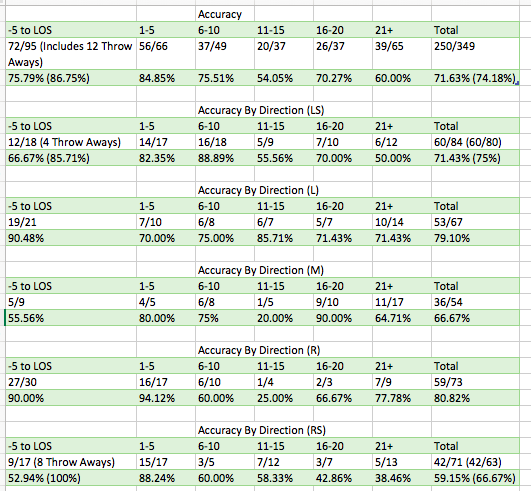
If you compare it to 2017, you’ll notice a slight dropoff, but I’ll explain why that is in a second. He once again threw the deep ball extremely well.

These are really impressive numbers and I’ll do my best to explain why. I mentioned the drop in accuracy/completion % above and I’ve mentioned this previously, but I will again.
In 2017, Milton’s average depth of target was 9.93. In 2018, it was 12.13. Which is extremely high and a huge jump. Also, it’s not because he threw more deep balls, if you actually look at the breakdown of his throws, it’s more because he threw a lot less passes at or behind the LOS under Heupel than Frost. Those are usually easy completions, thus increasing completion percentage and accuracy.
If you don’t think my numbers are accurate, here is some decent confirmation.
Breaking down the numbers even more, Milton averaged 10.69 air yards on his completions. Meaning the ball was caught 10.69 yards past the LOS on average, per completion. Rather impressive.
Net air yards/att is total air yards on completions divided by pass attempts. Milton’s number is very high, I don’t have much to compare it against, but it is about 2 yards higher than Brandon Wimbush and Jalen Hurts and 2 yards in average based off that many attempts, is a lot.
His 9.92 yards per attempt is also extremely high. All in all Milton had another insane season. Although, looking at his raw stats, you might think his production dropped a little. If you look at the context behind it and the numbers that are actually indicative of performance, there was no drop-off.

UCF used a ton of play action and Milton benefited from it.

If there is a knock on Milton this season, it’s how he performed when pressured. But, if you blitzed and didn’t record a pressure, Milton for sure made defenses pay.
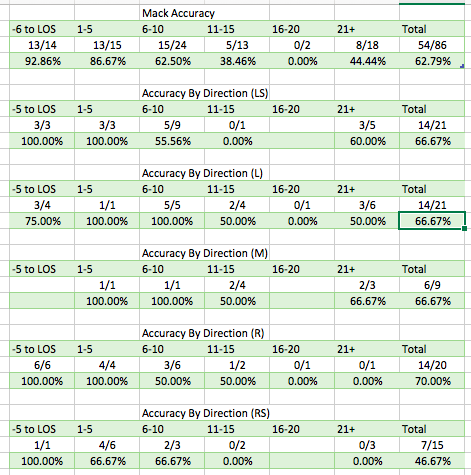
Mack’s sample size is a lot smaller so it’s harder to actually get a true grip on his performance. His accuracy at 62.79% is very solid. 8/18 on deep balls is not bad at all either. Milton is going to make anyone look bad when you’re numbers are next to each other.
But, if you look at Mack, he was 26/29 in terms of accuracy on balls thrown behind the LOS-5 yards downfield. This 100% skews his overall percentage because of such a low amount of throws.

While his aDot is extremely high, his per completion, net air yards, and YPA numbers suggest that most of his completions came on shorter throws. Now, he had multiple deep balls dropped that would have drastically effected these numbers just because of his low attempts, so it’s hard to look at these as a 100% indication of performance.

Mack was worse with play action than without it, which is surprising, again a very low sample size.

He, like KZ, also struggled under pressure.
The QB position will be an interesting one in 2019 without Milton as an option. Mack is obviously one of the guys in the running and his numbers from 2018 are extremely difficult to get a true read of his performance.
Running Game:
I think just about everyone knows the running back story. Greg McCrae was unbelievable, and Taj McGowan and Otis didn’t get the touches they deserved.
I’m going to talk about Otis Anderson in his own topic because I did extended research on his 2017 numbers and want to compare this season to last to show my point.

AK was put in a tough spot in Heupel’s system. I wrote about it in the off season and was pretty much spot on (humble brag), was going to quote what I wrote, but it’s a lot longer than I thought.
When AK got to play to his strengths, he was exceptional. However, he was used wrong, way too often. It’s not really rocket science, but this data, really nails in the point. The difference between his success on runs between the tackles and outside them is absurd.
On 31 rushes contacted at or behind the LOS, he only recorded 16 yards after contact. With so much RB depth, this is unacceptable to continuously put someone in a bad spot to succeed. AK is an unreal athlete and football player and didn’t get the opportunity to show off what makes him so good.

McCrae had 12 less carries than AK (FBS games only) and the numbers are drastically different. However, he also wasn’t great at limiting negative running plays when the opportunity presented itself.

Taj McGowan’s usage might get me the most upset over any other player. These are the numbers of a guy who only averaged 5 carries a game!! Why didn’t Taj get more carries? “Umm I don’t know, literally every time he touched the ball something really good happened so we wanted to make it fair for the other teams.”
McGowan had a 70% success rate. Averaged over 2 yards after contact, recorded almost 2 yards after contact when contacted at or behind the LOS, and gained about 7 yards a carry.
Oh, on 1st and 10 rushes…
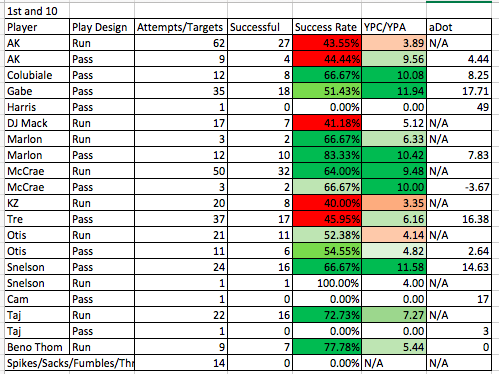
How’s a 72.73% success rate averaging 7.27 yards per carry? Pretty damn good. Probably better than your 6th best option in the situation.
He’ll be missed and did everything to deserve more work, I don’t care how good McCrae was.

Beno Thompson kind of had the Greg McCrae role from 2017. I didn’t chart McCrae after 2017 more because I was in a rush to get what I wanted to get done, done, but Thompson’s numbers look similar to what I would’ve expected McCrae’s to look like.
He was great up the middle and great after contact as well. He’s a guy that could be the McCrae of next season, but I think the depth at RB will limit that from happening next season.
Receiving:
Putting together these numbers, made me realize how much Snelson is going to be missed. I think Gabe Davis is the best receiver in terms of NFL future, but Snelson’s production was something else and moving him to the slot just took a ton of targets away from him.

Stupid good numbers. And he was good at every level of the field. Throw it short, good, medium, good, deep, on another level. Snelson had 65.45% success rate, caught 10 of 13 deep balls (21+ air yards) and had that one drop from Mack that I think everyone remembers.

Nixon’s success rate and catch rate is pretty disappointing, but he had 13 throws he was open on that the QB just didn’t give him a chance. That will put a major dent in your numbers.
He was tremendous on passes targeting him 1-10 yards past the LOS.
Gabe on other hand had a pretty similar year to last season, just with a lot more volume. 50% deep ball success is great. 8 drops isn’t the best, but he also made a couple of tremendous catches on inaccurate throws that don’t show up in these numbers.
His ceiling is insanely high.

Next season, Marlon Williams will finally get the targets he deserves. Williams posted 13.95 yards per target, over 5 yards after the catch, and a near 60% success rate. He’s really good and will get to prove it next season.

For some reason, I feel like I’ll be writing about Colubiale again next season. He was very effective when he got the targets. Everyone raved about Heupel’s tight end usage because they did zero research, so this is pretty much what I expected in terms of targets. However, his performance is was better than you can ask for.
And finally, the running backs:

It’s amazing when you get the ball to amazing athletes in a way that isn’t “expected”. AK caught 17 of his 22 targets, had a 63.64% success rate and averaged 17.41 yards per target. He turned short passes into big plays and deep passes into big plays… maybe a little more of this?
McCrae didn’t get as many targets, but he was really good on the few he did.
Josh Heupel:
This is probably where the 3 people who actually read these outside of the people I force to, will stop reading and that’s simply because “I’m an idiot if I think I know more than a coach”.
One, I don’t. If you asked me to create an offensive playbook with route combos, run blocking schemes, etc, I wouldn’t even get through one play. That is “coaching” football. Understanding situations and numbers is completely different. I am literally going to present facts to back this up and it really isn’t much rocket science to understanding this information, it’s just most people choose to pretend it doesn’t matter.
Two, a little biased, but the amount of value this type of information can bring to a program/team is high.
Going 12-0 is nice and all, but that doesn’t mean everything was perfect from an in-house view. And I think a lot of it showed when UCF wasn’t the clear and most talented team on the field against LSU.
All right:
Personnel:

Heupel used “11” personnel on 64.56% of plays. Now, when I get into explaining Otis Anderson’s role, you’ll understand why this number is really a lot higher.
I charted Otis as an RB all season, however, his role was pretty much designed as a receiver when he was on the field with another RB which is almost every “20” and “21” play.
Still, UCF’s success rate was a 48.95% out of “11” personnel. No other grouping was below 53.59%. Yet, “11” was used the most. And there is no answer for this because UCF has plenty of versatile RB’s so depth isn’t an excuse.
Otis Anderson:
Otis is probably the guy I root to succeed the most. He is so good and I think his ability to help out the team and prove himself is limited.
In 2017, I charted a lot of stuff about Otis:

I don’t exactly care too much about the field position numbers.
He was obviously really good overall. As a receiver, S/W/T he thrived as well as in the backfield.
What I want to look at are his numbers based on personnel. So I broke it down to 2 RB’s on the field or just him (I don’t care about TE’s for this).
13 of his 30 plays out of a 2 RB look, were rush attempts. 4 of them were targets out of the backfield. So 17 of his 30 snaps were from lining up in the backfield. Literally the purpose of using 2 RB’s. Using multiple formations where you can line them up in all different ways so the defense has to adjust.

This season, he didn’t get a single target out of the backfield with 2 RB’s on the field and only ran the ball 9 out of 35 plays in which is was the target or ball carrier. So he went from a 50/50 split to about a 75/25 split.
Only 4 of his 30 targets came out of the backfield. So based on the grouping Otis was on the field with, as a defense, you pretty much knew what to expect. The rare time he lined up the backfield with another back on the field, he was getting a carry.
With one RB on the field, you didn’t have to worry about him splitting out wide against a LB, because he was running the ball just about every time he was the focal point of the play.
Heupel, in my opinion, took the versatility away from his most versatile and most explosive all around player by almost telling you what he was going to be doing based on personnel usage.

I think it’s a big reason why his receiving numbers are a little lower than I’m sure he had his goals on and really what they should have been.

His running numbers were still pretty damn good, but a lot less carries than there should have been.
Situational Play Calling:
Now the really fun stuff and the real actual important stuff.
Run vs. Pass advantage based on down and distance:

1st and 10. This is a solid chart. Nothing exactly to be upset about here and I’m not going to reach for anything to try and act smart.

2nd Down. Hmmm, let’s take a look at 2nd and medium (5-9 and 3-5) where it’s a pretty big situational decision. In fact, it happened 178 times. Heupel went run on 108 of these “establish the run”. When, passing the ball was so much more effective and it’s not even close.
On 2nd and 5-9, passing the ball gained 7.27 more yards per play and was successful 10.48% more often than rushing the ball. Now, if you want to look at that and try and come up with an excuse as to why running the ball 25% more than passing the ball is smarter than throwing the ball, just stop reading.
On 2nd and 3-5 the run pass split gets greater (75/25), but the pass advantage gets smaller, although their is still a significant advantage.
Yes, you can’t go 100% pass and 0% runs in these spots, it’s about finding the right balance, but these splits are a joke. Giving your team the best possible chance to be successful in every situation is important and using data to actually make those decisions rather than just having a preference and thinking what is right is what’s smart.

On 3rd down it flips because common thought is the only way we can get 3-9 yards on one play is by throwing the ball!!!! Wrong. What do you think every D coordinator is expecting? Pass. That’s why running the ball works. Being unpredictable. You can read the numbers on the chart, but I’d say those are some rather big disadvantages when throwing the ball.
And 4th down just because I have it:

Early Down Success:
Woah, this stuff might actually be important. You know how you do really well on third downs? You limit the amount of the ones you face because you do really good on first and second. Yes, UCF was great on 3rd down, but they were also good on early downs which helps a ton.

Can’t complain about any of this. However, UCF did struggle on 2nd downs.

And 2nd down is a spot they went 52% run despite having a major advantage when throwing the ball.
I also charted just the first two plays of every drive. I took out the second play if it was a 1st down play.

The percentages drop and I think it’s a great way to show how important an offense that loves tempo excels when they record that first, first down on a drive.
So how do they improve in this area?
Yes, the early down success numbers are terrific, but against better competition, this stuff means more and we saw that with LSU.
So, I went and charted every down and distance situation based on who was the target or ball carrier.
Who was UCF’s most effective player on 1st and 10?
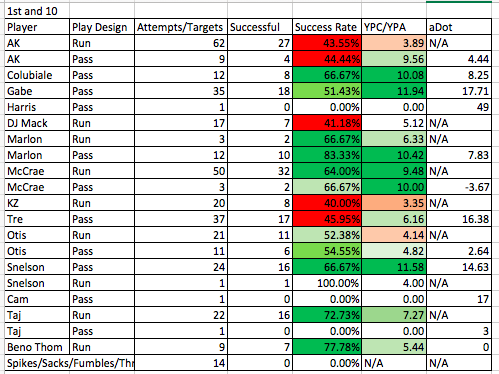
As you can see, there were numerous guys who were very effective, but the thing that jumps out is AK’s usage. 62 of his carries came on first and 10. This despite not being very effective.
I used these charts on here previously so I won’t put every one, but the important down and distances I’ll include.
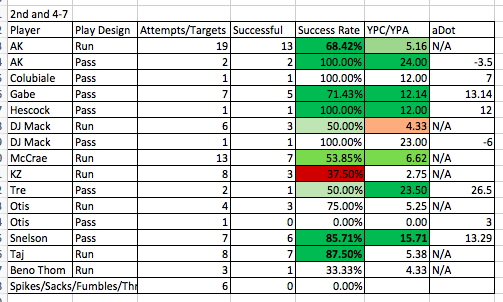
Here, AK excelled. It was a great situation to get him the ball. Taj at 87.50% though.
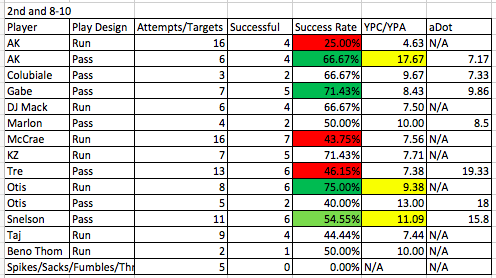
And 2nd and 8-10.
2nd down play calling based on 1st down result:
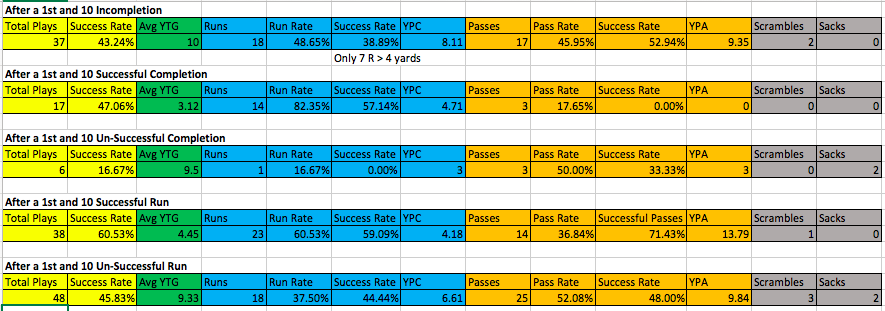
Included in this data is every 1h play and every 2h play that came in a one score game.
After a first down incompletion is one of the worst times to run the ball. Yet, UCF did it 48.65% of the time despite averaging more yards per play (ypc is skewed by a few big runs) and having a 14% higher success rate on pass attempts.
If UCF completed a first down pass for a successful play, they ran the ball on the following play just about every time.
Following up a successful run with another run, was also a big trend despite having a 71.43% success rate and averaging nearly 10 more yards per lay when throwing the ball.
2nd down is huge, making the right decision on your play call is extremely important. There’s an advantage to doing something on every play and if you look at opponent defensive numbers as well, now you’re really talking about making good decisions.
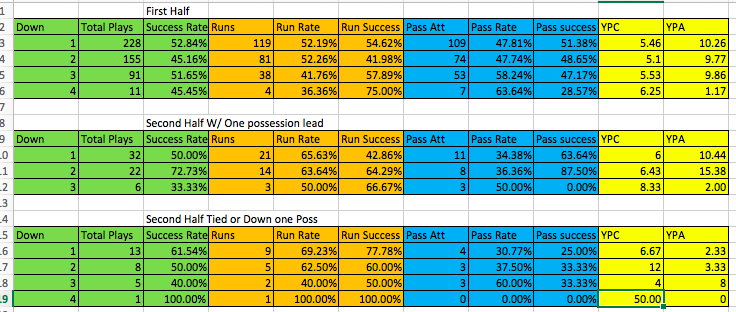
The last thing I got. With a one possession lead, you bet you ass, Heupel was running on first down. But, just maybe, throwing the ball would be a better option.
Second half numbers are extremely low in sample size just because UCF didn’t play many one possession games.
That concludes all I’ve got to say. While I know most of you just came here to look at player success, the point of looking at all this information was to explain how valuable it is.
Being better, talent wise, by a pretty big margin, can hide a lot of this stuff behinds wins and losses, but when you play teams like LSU, it actually matters.
You get your, best players on the field, in the situations that they excel in, and make the better decision on run/pass more often than not, you’re going to put your team in a heck of a situation to win the game, regardless if execution is as crisp as you’d hope.
Combine this, with looking at defensive numbers for the same stuff and as a team, you’re going to be pretty damn hard to stop.
